Poisson Distribution

X ~ Po(λ)

λ: mean rate at which an event occurs.

The Poisson distribution is a discrete distribution used to calculate the probability that a given number of events occur over a given interval.

Example

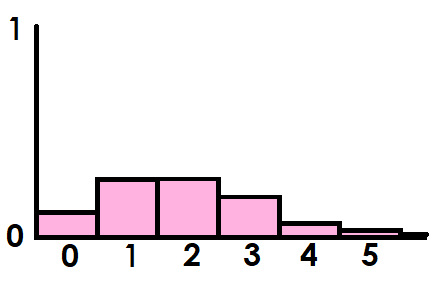
X ~ Po(2): The probability that x events occur in an interval where the average number of events is 2.

Poisson Graph

Conditions

  • Each event is independent
  • Events occur at a constant average rate (λ)
  • Events cannot occur at the same time

Formulae

x: the number of events occurring

P(X = x) =
eλx
x!
E(X) = λ
VAR(X) = λ

Enter the parameters for the Poisson distribution:

Parameter: λ


This calculator does the following

  • Displays the statistics for the defined distribution
  • Calculates the probabilities for a given value of x
  • Calculates the inverse for a given probability
  • Calculates the values for a hypothesis test given the significance level: H0, H1, the critical region, probability of a type I error and the probability of a type II error given the actual parameter.
  • Calculates the values for a hypothesis test given the critical region: H0, H1, the test size, the test power for the actual parameter or the power table if no parameter is specified.
  • Displays a table of probabilities for the distribution